We have a simulation setup to show the disadvantages of using random numbers at our Why Page.
The goal of that page - How many rolls of the dice will it take for each number to appear at least once?
We can give you the answer for systematically - it is always 6.
Random is a different story.
For each number to be hit at least once with random, the results can be anything from 6 to SOMETHING.
We asked ourselves, how high could this SOMETHING go?
We wrote another simulation to figure that out.
We did the side by side compare 1,000,000 times.
That is a million times running the "why" simulation.
Below is a snapshot of the results.
Results
Here is a breakdown of how many rolls it took for all six sides of a dice to show up at least once including the frequency and how more efficient systemmatic is over random selections.
| Number of Rolls | Frequency | Efficiency of Systematic |
| 6 | 15,316 | 0 |
| 7 | 38,606 | 16.7 |
| 8 | 60,225 | 33.3 |
| 9 | 74,701 | 50 |
| 10 | 82,813 | 66.7 |
| 11 | 84,367 | 83.3 |
| 12 | 81,503 | 100 |
| 13 | 75,622 | 116.7 |
| 14 | 69,230 | 133.3 |
| 15 | 61,554 | 150 |
| 16 | 54,073 | 166.7 |
| 17 | 46,635 | 183.3 |
| 18 | 39,948 | 200 |
| 19 | 34,248 | 216.7 |
| 20 | 29,005 | 233.3 |
| 21 | 24,673 | 250 |
| 22 | 20,737 | 266.7 |
| 23 | 17,489 | 283.3 |
| 24 | 14,935 | 300 |
| 25 | 12,179 | 316.7 |
| 26 | 10,164 | 333.3 |
| 27 | 8503 | 350 |
| 28 | 7325 | 366.7 |
| 29 | 5906 | 383.3 |
| 30 | 5155 | 400 |
| 31 | 4149 | 416.7 |
| 32 | 3537 | 433.3 |
| 33 | 2968 | 450 |
| 34 | 2356 | 466.7 |
| 35 | 1998 | 483.3 |
| 36 | 1651 | 500 |
| 37 | 1339 | 516.7 |
| 38 | 1153 | 533.3 |
| 39 | 1025 | 550 |
| 40 | 761 | 566.7 |
| 41 | 700 | 583.3 |
| 42 | 576 | 600 |
| 43 | 475 | 616.7 |
| 44 | 427 | 633.3 |
| 45 | 300 | 650 |
| 46 | 287 | 666.7 |
| 47 | 213 | 683.3 |
| 48 | 174 | 700 |
| 49 | 148 | 716.7 |
| 50 | 151 | 733.3 |
| 51 | 113 | 750 |
| 52 | 100 | 766.7 |
| 53 | 82 | 783.3 |
| 54 | 64 | 800 |
| 55 | 60 | 816.7 |
| 56 | 37 | 833.3 |
| 57 | 26 | 850 |
| 58 | 27 | 866.7 |
| 59 | 43 | 883.3 |
| 60 | 23 | 900 |
| 61 | 15 | 916.7 |
| 62 | 14 | 933.3 |
| 63 | 15 | 950 |
| 64 | 15 | 966.7 |
| 65 | 12 | 983.3 |
| 66 | 7 | 1000 |
| 67 | 13 | 1016.7 |
| 68 | 6 | 1033.3 |
| 69 | 5 | 1050 |
| 70 | 2 | 1066.7 |
| 71 | 3 | 1083.3 |
| 72 | 5 | 1100 |
| 73 | 1 | 1116.7 |
| 75 | 2 | 1150 |
| 76 | 2 | 1166.7 |
| 80 | 3 | 1233.3 |
| 81 | 1 | 1250 |
| 83 | 1 | 1283.3 |
| 85 | 1 | 1316.7 |
| 89 | 1 | 1383.3 |
| 92 | 1 | 1433.3 |
| Σ Number of Rolls x Frequency | 14,702,658 |
Summary of the Results
With six sided dice (fair), the odds of any side of the dice to come up is 1 in 6.
In the sampling above, the worst case scenario was 92, with one occurrence.
92 rolls for each number to come up at least once.
That is a ridiculously high number.
But 1,000,000 times doing the why simulation is also a very high number.
With systematic, the number of rolls was always 6.
So with 1 million attempts, there would have been 6,000,000 rolls, ie. 6 x 1,000,000 of the systematic dice.
With random, as you can see above, there were 14,702,658 rolls.
Based on our efficiency calculation, systematic is 145% more efficient on average than random.
This is based on the calculation (14,702,658 / 6,000,000 * 100) - 100
Other interesting tidbits from the above data.
11 rolls had the highest frequency, with 84,367 times.
The higher the rolls, the less frequency (which one would expect).
There are some rolls between the lowest and highest which were never hit, for example 82, 84.
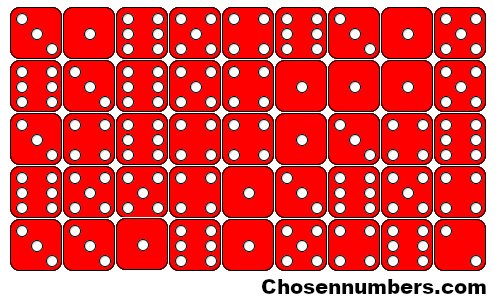
The image that we have included with this article could have been one of the 300 hits out of 1,000,000 where 45 was the number of rolls so every number was hit at least once - with 2 being the pesky rascal which was hindering the odds.
Conclusion
Random numbers are interesting, but they are no way to choose lottery numbers.
One would figure the odds of rolling a dice are 1 in 6.
The reality is the odds are 1 in 14.7, factoring in duplicates.
In our sampling, the number of rolls got as high as 92.
With 92 rolls, the efficiency of systematic over random is 1350%, but that is the worst case scenario in our sampling.
Systematic is the way to go.
Always 1 in 6.
Use chosen numbers selections, it uses a systematic approach.
Systematic is the proper method when playing the lottery.